Derivatives Rollover Report |November 30, 2018
What a splendid series it was for our markets as it brought back wide smile on traders’ / investors’ faces post consistent fall
in previous two series. The 10000 mark acted as a very strong base and we witnessed a v-shaped recovery of more than 7%
(highest gain post March 2016).
During the series, we saw blend of short covering and fresh long formation in Nifty Futures. Stronger hand too participated
in this rally as they turned net buyers in equities, index and stock futures segment. Now, their index futures ‘Long Short Ratio’
has jumped from 29% to 51%, indicating they covered decent shorts and rolled their longs to December series. Rollover for
Nifty stood at 71%, lower in terms of percentage as well as open interest. At current juncture, 11000 on the upper side and
10500 on the lower side are attracting trader’s attention. Considering the above data point, we would advise traders to
trade with a positive bias going ahead.
Rollover for the banking index is although slightly lower in percentage term but is on the higher side if open interest is
considered. Except for YESBANK, the entire banking pack did quite well last series. During the series, we saw good
amount of long formation in BankNifty and these positions have been rolled over too. Hence, we expect continuation
of ongoing move towards 27500-27700.
Indices Change
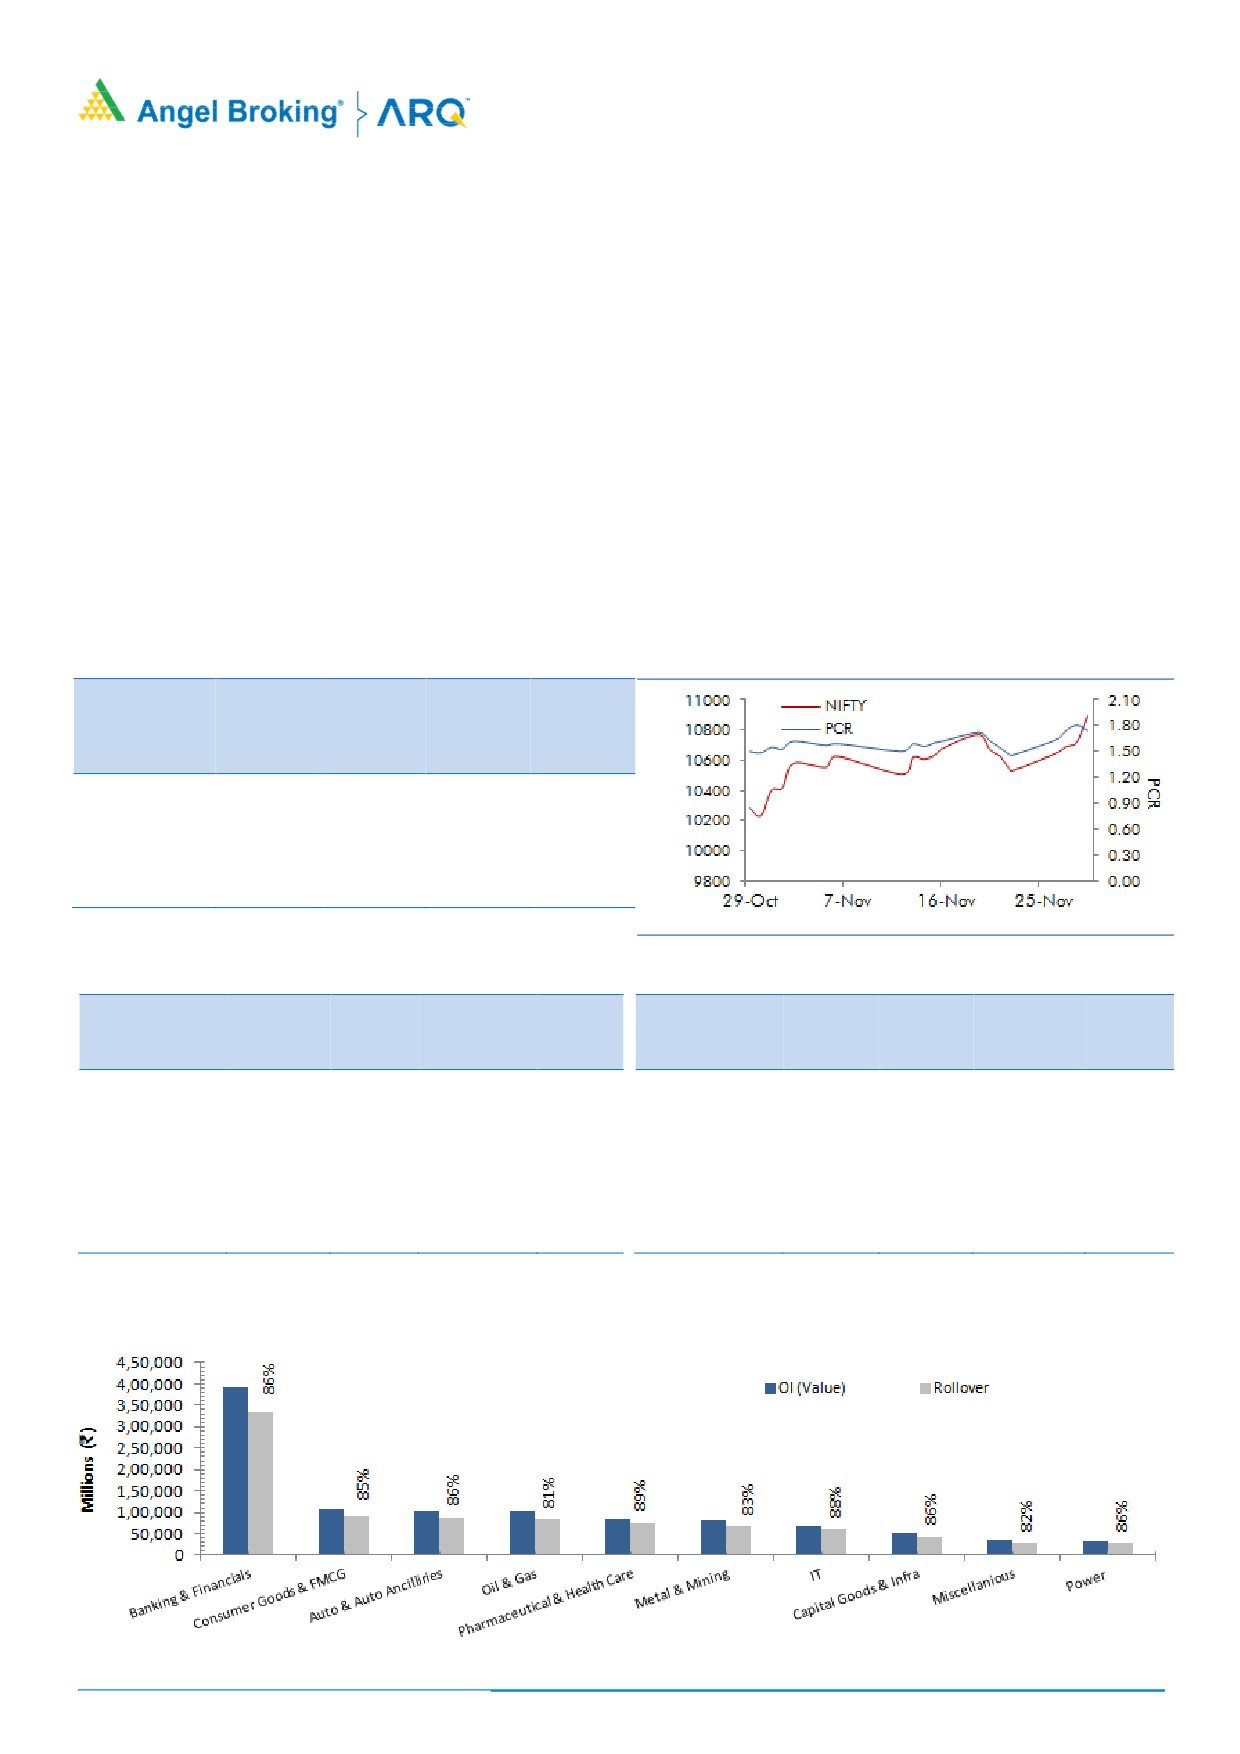
NIFTY & PCR Graph
Price
Change
3 month
INDEX
Price
(%)
Rollover
avg.
NIFTY
10858.70
7.04
71.23
69.85
BANKNIFTY
26939.60
7.81
72.17
72.17
NIFTYIT
14465.25
2.73
72.42
74.04
NIFTYMID50
4761.25
6.59
99.97
99.97
Monthly Gainers
Monthly Losers
Price
Ol
Price
Ol
Change Open
Change
Change Open
Change
Scrip
Price
(%)
Interest
(%)
Scrip
Price
(%)
Interest
(%)
ADANIPOWER
56.10
67.96
146540000
(8.81)
YESBANK
161.35
(19.24)
164053750
42.24
PCJEWELLER
68.75
43.23
6832000
(24.95)
EQUITAS
106.65
(17.20)
10928000
19.04
BEML
768.50
40.79
1012900
(34.21)
SUZLON
5.15
(15.57)
300316000
8.36
JETAIRWAYS
307.90
33.87
4135800
(23.82)
CIPLA
527.10
(14.06)
8470000
(0.87)
NCC
98.37
48.49
43943546
(2.05)
COALINDIA
246.10
(13.21)
30641600
111.54
Note: Stocks which have more than 1000 contract in Futures OI.
Note: Stocks which have more than 1000 contract in Futures OI.
For Private Circulation Only
1
Derivatives Rollover Report
Research Team Tel: 022 - 39357800 Extn-6824
DISCLAIMER
Angel Broking Limited (hereinafter referred to as “Angel”) is a registered Member of National Stock Exchange of India Limited,
Bombay Stock Exchange Limited and Metropolitan Stock Exchange Limited. It is also registered as a Depository Participant with CDSL
and Portfolio Manager and Investment Adviser with SEBI. It also has registration with AMFI as a Mutual Fund Distributor. Angel
Broking Limited is a registered entity with SEBI for Research Analyst in terms of SEBI (Research Analyst) Regulations, 2014 vide
registration number INH000000164. Angel or its associates has not been debarred/ suspended by SEBI or any other regulatory
authority for accessing /dealing in securities Market. Angel or its associates/analyst has not received any compensation / managed
or co-managed public offering of securities of the company covered by Analyst during the past twelve months.
This document is solely for the personal information of the recipient, and must not be singularly used as the basis of any investment
decision. Nothing in this document should be construed as investment or financial advice. Each recipient of this document should
make such investigations as they deem necessary to arrive at an independent evaluation of an investment in the securities of the
companies referred to in this document (including the merits and risks involved), and should consult their own advisors to determine
the merits and risks of such an investment.
Reports based on technical and derivative analysis center on studying charts of a stock's price movement, outstanding positions and
trading volume, as opposed to focusing on a company's fundamentals and, as such, may not match with a report on a company's
fundamentals. Investors are advised to refer the Fundamental and Technical Research Reports available on our website to evaluate
the contrary view, if any.
The information in this document has been printed on the basis of publicly available information, internal data and other reliable
sources believed to be true, but we do not represent that it is accurate or complete and it should not be relied on as such, as this
document is for general guidance only. Angel Broking Limited or any of its affiliates/ group companies shall not be in any way
responsible for any loss or damage that may arise to any person from any inadvertent error in the information contained in this
report. Angel Broking Limited has not independently verified all the information contained within this document. Accordingly, we
cannot testify, nor make any representation or warranty, express or implied, to the accuracy, contents or data contained within this
document. While Angel Broking Limited endeavors to update on a reasonable basis the information discussed in this material, there
may be regulatory, compliance, or other reasons that prevent us from doing so.
This document is being supplied to you solely for your information, and its contents, information or data may not be reproduced,
redistributed or passed on, directly or indirectly.
Neither Angel Broking Limited, nor its directors, employees or affiliates shall be liable for any loss or damage that may arise from or
in connection with the use of this information.
Derivative Research Team
For Private Circulation Only
8